What's new in Monica v7.1.0
Introduction
In November 2024, we released a new version of Monica - v7.1.0. This release is far for minor and it makes us excited sharing the details with you. The upgrade includes: three major features, several medium-sized enhancements, and a significant increase in system scalability through the addition of active-active high availability mode. This addition is beneficial to operators of complex ground systems with multiple antennas and instruments - who prioritise high reliability and scalability - both delivered in this release.
About Monica
A quick reminder - Monica is our monitoring and control (M&C) solution designed to empower customers managing ground segment infrastructure and systems in reliable and efficient way. The solution is used in various industries, including RF and optical satcom, television and radio broadcasting, telecommunications, cable TV, and SCADA system management.
Version 7.1 summary
Main changes introduced in v7.1 are:
1. Active-active High Availability with Load Balancing
2. Scheduler upgrades
3. Charting upgrades
4. Other changes
Read about it in the following sections. We hope you'll like it.
Don’t hesitate to send us your feedback. Details are provided in the Get in touch section at the end of this page.
1. Active-active high availability with load balancing
Previous high availability implementations were based on an active-passive principle, provided by WildFly’s singleton deployment feature. The passive node would be in a warm backup state and, on failover, it would boot to active state. This process takes a few minutes - and longer for systems managing thousands of instruments. Moreover, this solution did not scale effectively. The usage of additional resources wasn’t efficient either.
To overcome this challenge we’ve introduced comprehensive cluster support. Details about the Cluster manager and HTTP load balancer are described in the following sections.
1.1 Cluster manager
For the first time since Monica’s existence, the version 7.1 application code is aware of the cluster it is run in. We added a new screen - called Cluster Manager - showing an overview of a Monica cluster.
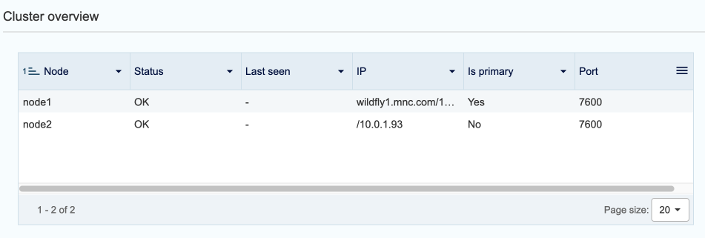
In this setup, we can have any number of nodes. All nodes can be active at the same time and are ready to accept user requests or perform polling, calculations, or other typical M&C operations.
1.1.1 Types of operations in a clustered environment
There is no magic wand that could enable us to implement active-active support in all M&C operations - even though we wouldn’t mind if there is one! Hence, we had to carefully analyse and decide how to handle each method.
We ended up with three distinct use cases we are supporting in v7.1:
I. Fully active-active operations
For this kind of operations, it’s irrelevant which node performs a request, primary or non-primary node. It mostly covers CRUD operations and simple business logic. It enables direct scalability towards a number of end users - more nodes will allow for more concurrent Monica users or HTTP requests. One page load can vary between 5 to 50 HTTP requests, ultimately leading to much better performance.
II. Distributed resources
Distributed resources are bound to a single, dedicated node in the cluster. For our initial implementation, we chose Instruments and Instrument groups as natural candidates. That means each instrument will be handled by one node in the cluster, leading to direct horizontal scalability. Adding more nodes will allow handling a greater number of instruments.
III. Primary-only operations
Some parts of business logic need to stay in singleton mode, either due to lack of distribution support in underlying library (Rule engine), or due to our implementation details (Alarm component). This kind of operations will always be invoked on the primary node, which will act as the brain of the cluster.
1.2 Load balancing in active-active high availability
To allow seamless operation of the cluster from a single GUI, we added an HTTP load balancer (HAProxy) component as the gateway into Monica in cluster mode. It will ensure that each HTTP request targets the correct node, depending on the REST request URI (Uniform Resource Identifier) and on the setup of the backend cluster. It also seamlessly covers the failover use case.
For resource (instrument) distribution, there are two approaches:
Automatic - on cluster events like failover, node leaving, and node joining
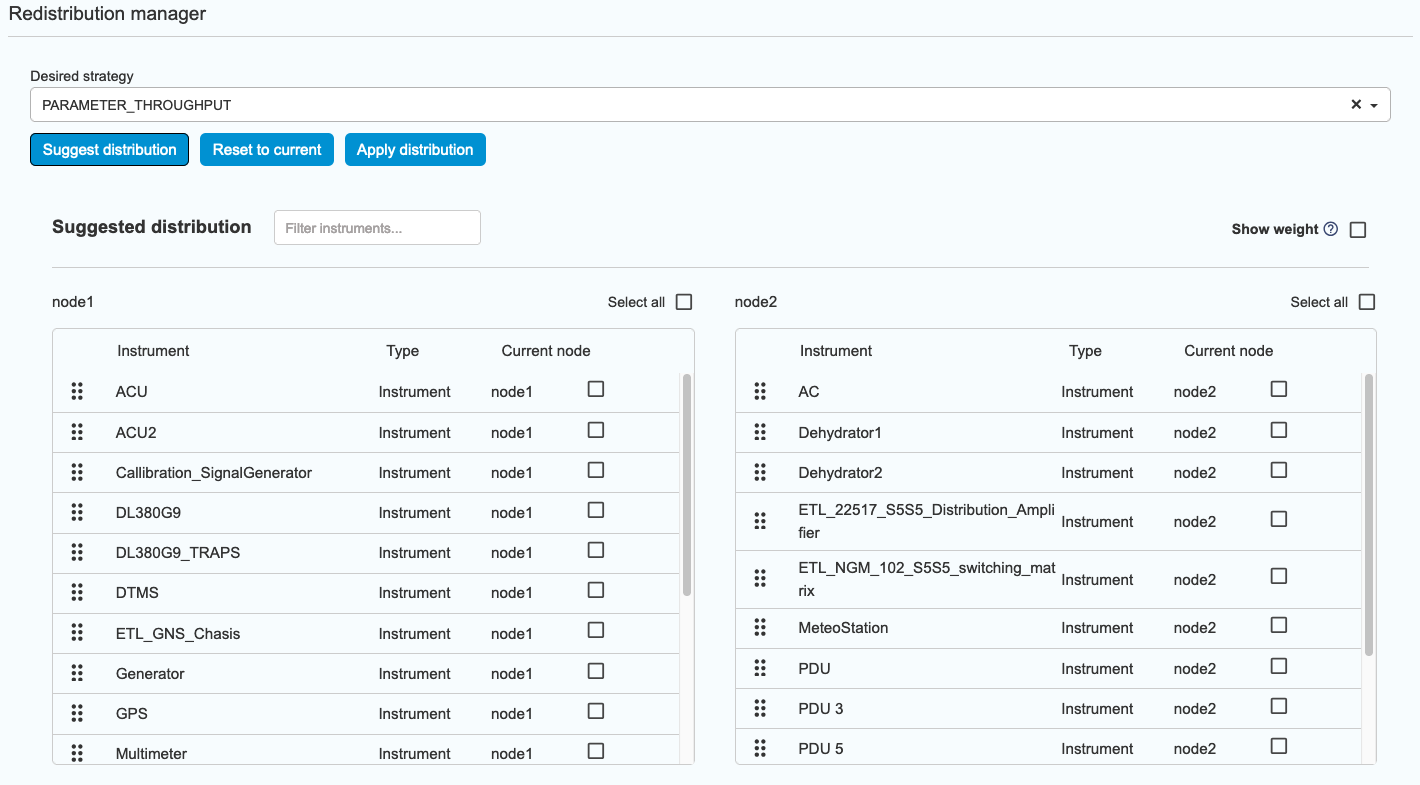
Manual - it’s possible to manually redistribute instruments with the help of system-provided suggestions, based on instrument count, parameter count or parameter throughput. This functionality is provided by the following wizard:
By moving high availability logic into our application layer, we can have it intertwined with existing Monica modules, such as Logging and Alarming. There will be appropriate logs and alarm events for interesting cluster events:
Instrument has changed managing node
Node left cluster
Node joined cluster
Failover in progress (CRITICAL)
Node missing (WARN)
1.3 Other improvements
The new active-active high availability approach brought few additional enhancements described in sections below.
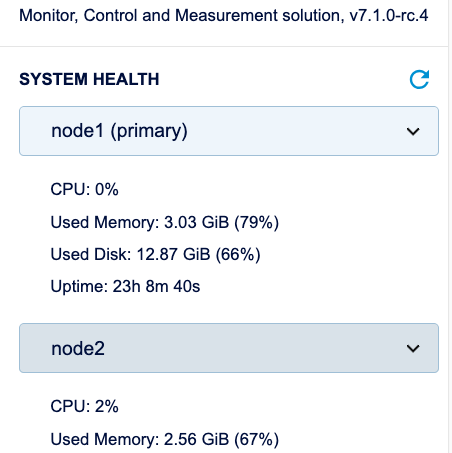
1.3.1 System health information
We extended the system health information. Monica v7.1 displays system health info per-node.
1.3.2 Deployment updates
For the first time on the Monica project, we dared to create a custom WildFly subsystem taking care of correct deployment order, eliminating the need for the installer to take care of following a correct order (custom DeploymentUnitProcessor).
2. Scheduler upgrades
The second big feature revamp is related to the Scheduler component, which finally receives more love from our side. The main changes are outlined below.
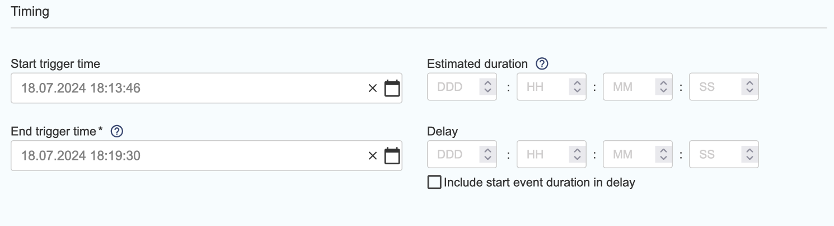
2.1 Composite jobs
Composite jobs consist of a start and an end event, and are commonly used for scheduled “prepare & cleanup” actions. The end event can be defined in absolute time or using a delay after start event time. Start and end can have different types of operations - i.e. start event can run a script, while end event can generate a report.
2.2 Deep linking of scheduled jobs to underlying activity
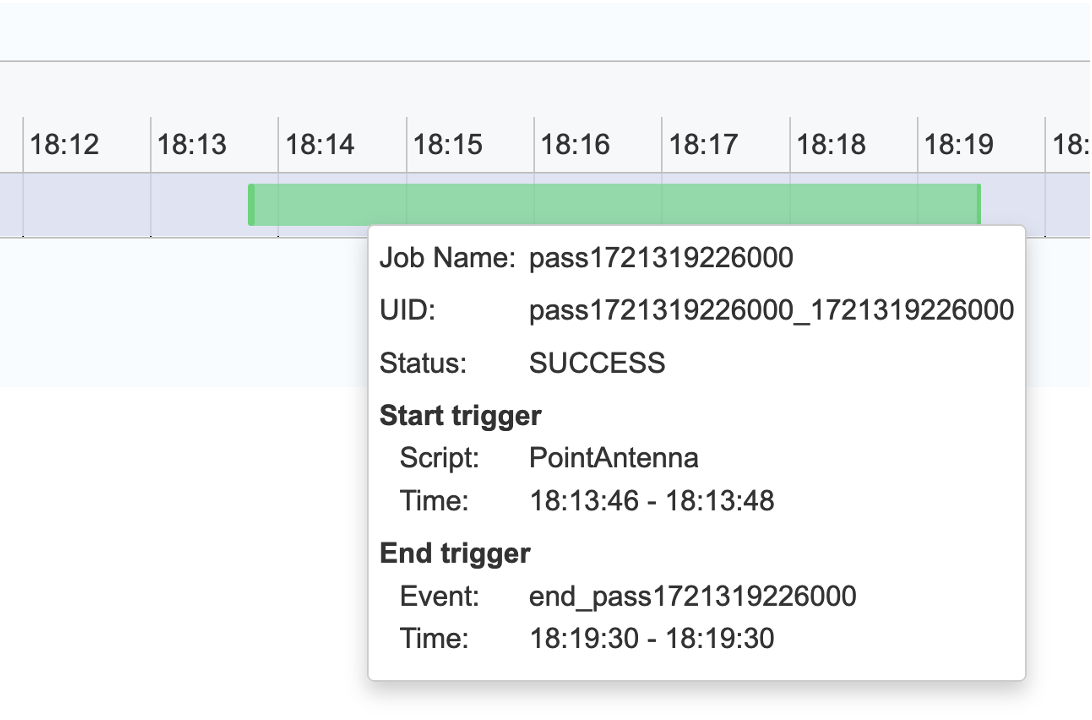
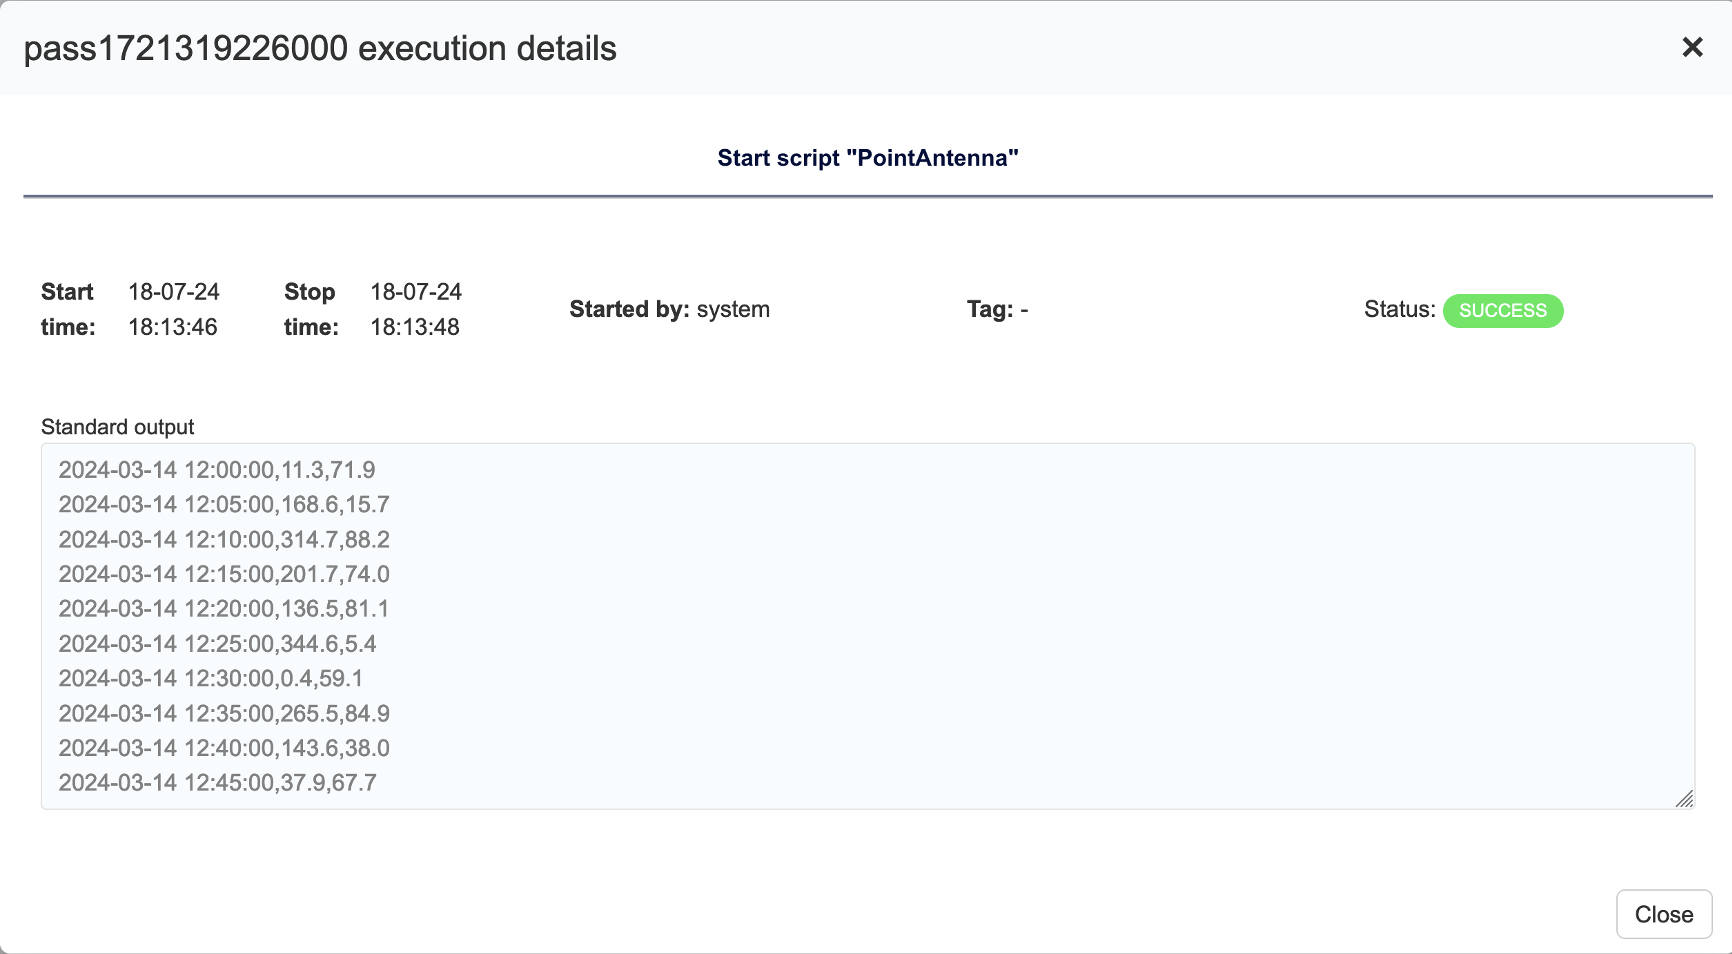
Operations run by Scheduler (scripts, reports) were rather decoupled from the Scheduler component and Timeline view. One example - there was no insight into scheduled script status from Timeline view.
We made it possible in Monica v7.1. Now, it’s possible to view script or report status and details from Timeline view.
Also, scheduled job status will reflect the status of the activity - which means if the script fails, the job will be marked with an error status.
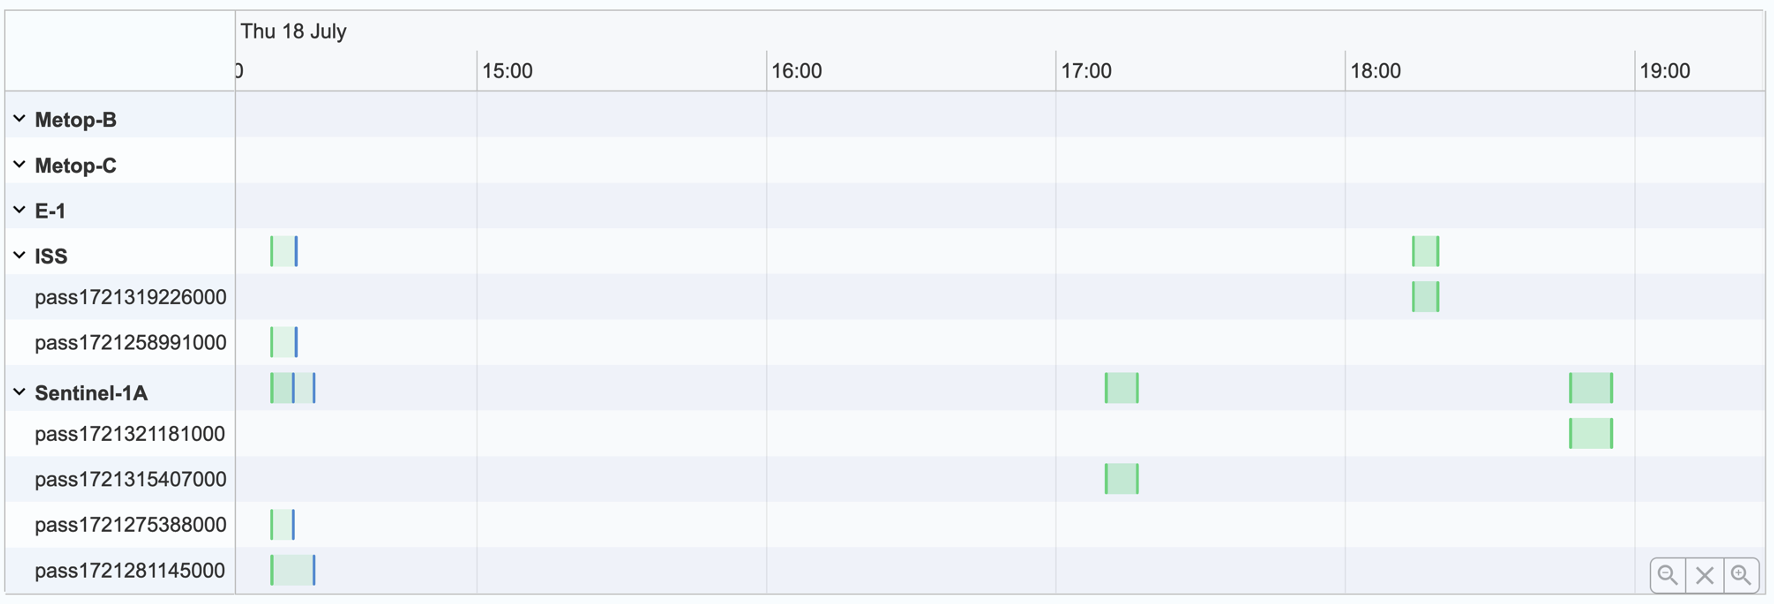
2.3 Job grouping
Jobs can now be grouped into any number of groups (tags, categories), and displayed within those groups. A group can be anything - a user input such as antenna, satellite or similar.
The timeline can be shown with grouped jobs, where multiple jobs from the same group are displayed in the same line.
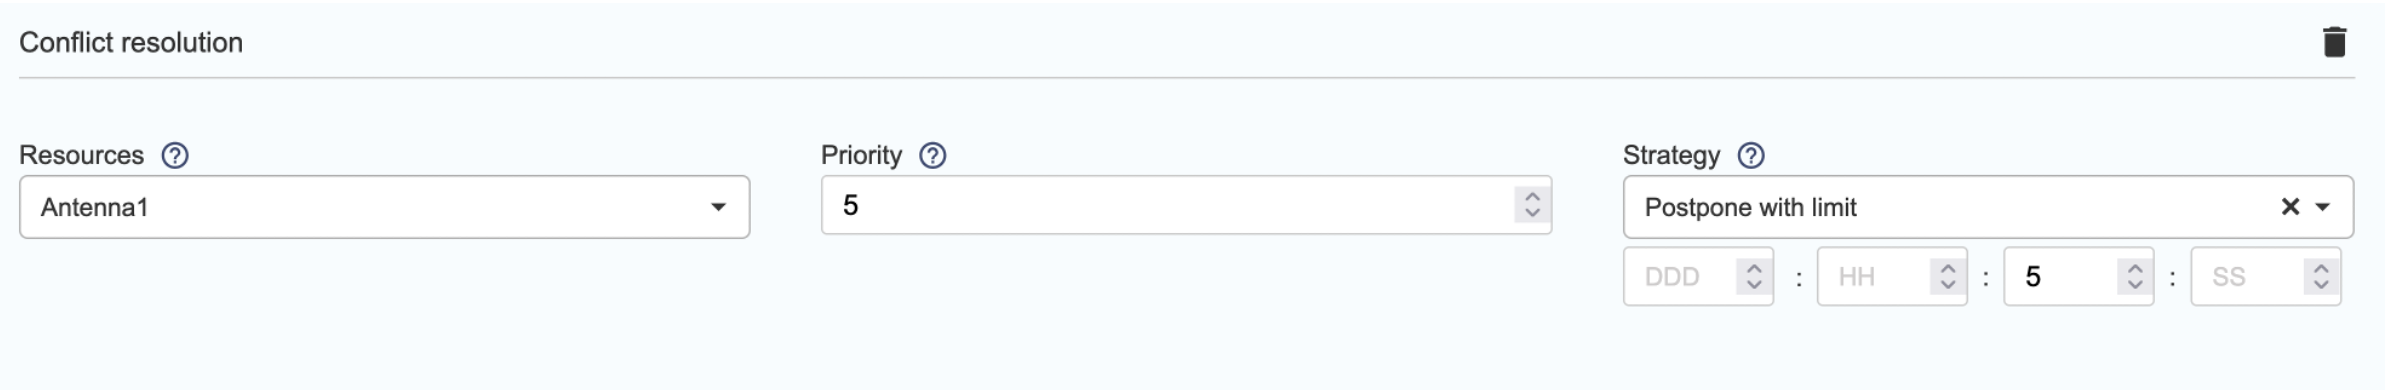
2.4 Conflict resolution
Each job can be marked with a conflict resolution strategy, consisting of:
resource ID
priority
strategy, with three possible values: postpone indefinitely, postpone up to X times or cancel
This enables use cases where low-priority jobs can be cancelled or postponed if a higher-priority job is already running.
3. Charting upgrades
The third notable big feature revamp is the Charting component. Up until version 7.0, charting component supported only one type of charts - timeline charts showing parameter values. Our main goals here were to:
Show other types of data on charts, besides historic parameter values such as alarms, logs, thresholds, ranges, and bar andpie charts
Improve analytics capabilities using different types of charts
Utilise unused features from the Highcharts library
Explore Grafana-like functionalities
Improve TSDB API – limiting the number of points and auto-aggregation.
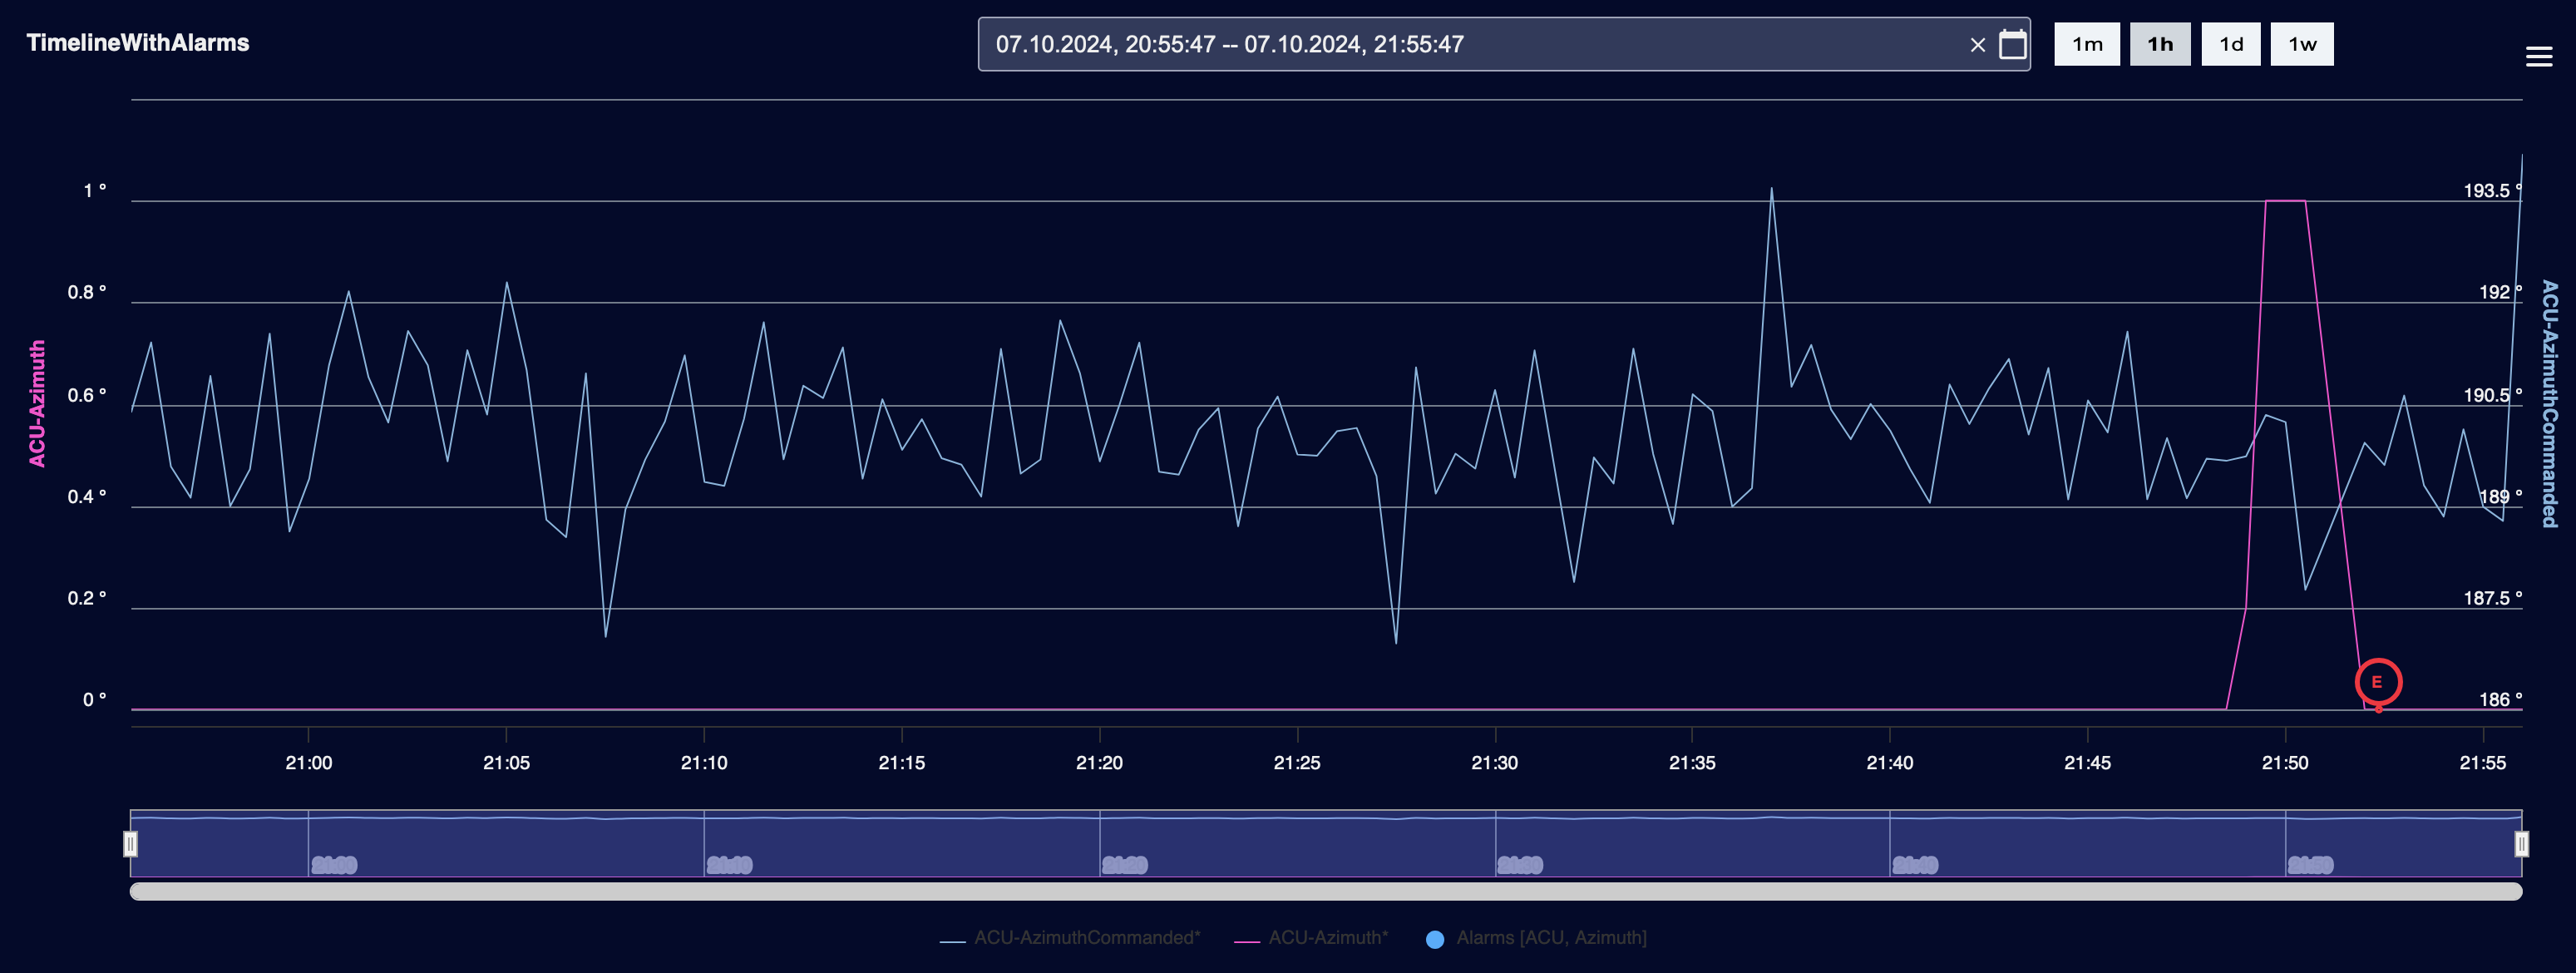
3.1 Timeline charts
The first big chunk of work was to extend existing timeline charts with options to display:
Alarms - flags with severity-matched colour – positioned on corresponding parameter line/point if available
Log entries - flags similar to alarms, but positioned near the top of chart
Plotlines - display straight line, i.e. threshold from Instrument property or Registry value
Constraints - directly display different ranges from driver as different background colours on the chart
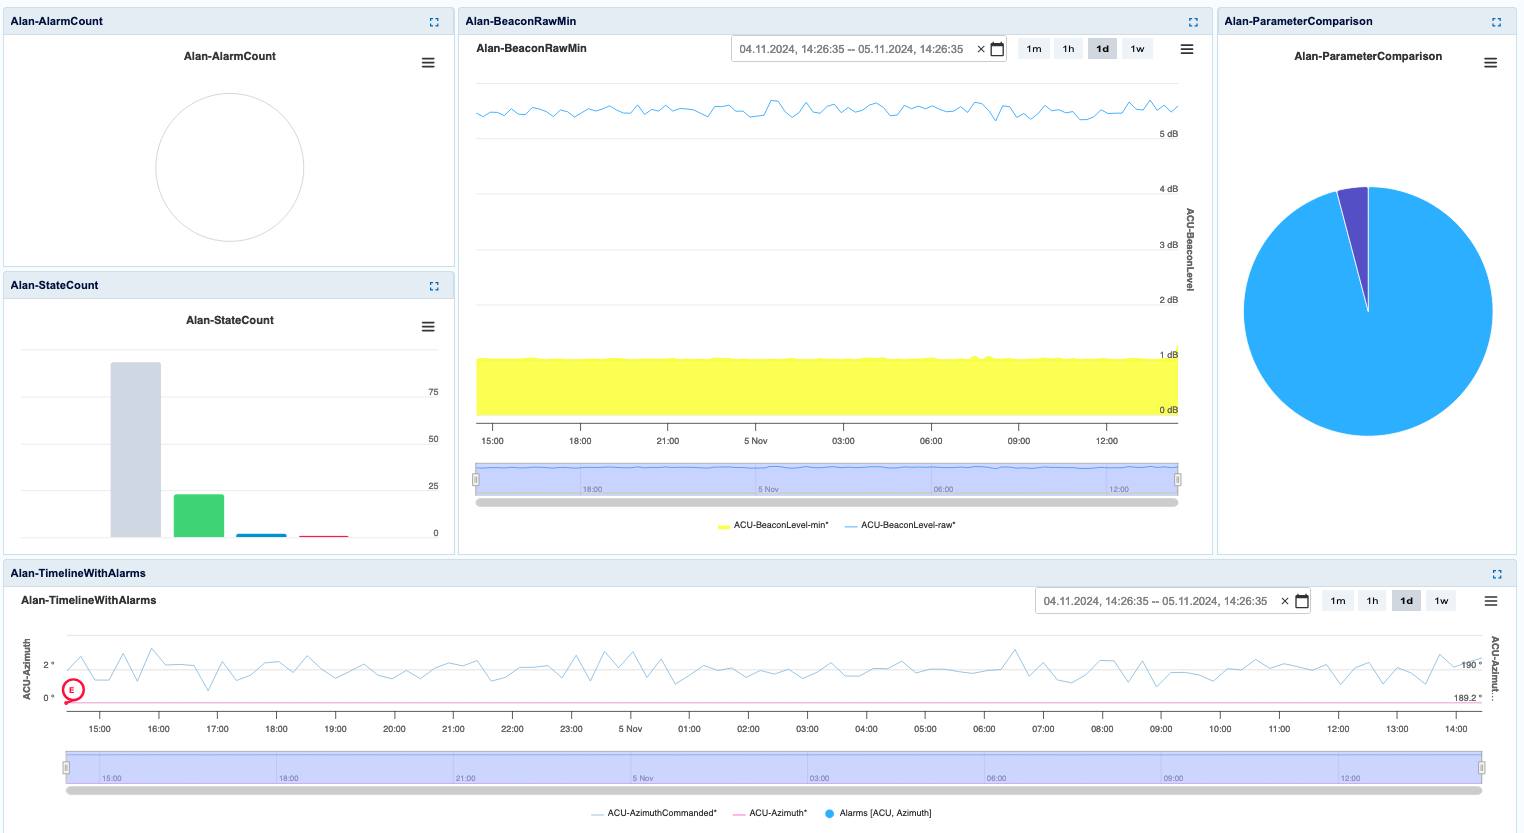
3.2 New chart types
In addition to timeline charts, we introduced 9 (nine) new chart types:
Alarm Count - Top alarms by count in a time period
Alarm Duration - Top alarms by their duration in a time period
Alarm Timeline - Alarm durations as tracks on a timeline
State Count - Top states by count for specific or all instruments in a time period
State Duration - Durations of states for specific instruments in a time period
State Timeline - Instruments as tracks on a timeline, with their states represented as a color of the line
Mode Count - Top modes by count for specific or all instruments in a time period
Parameter Value Duration - Histogram of parameter value durations with configurable time buckets
Parameter Value Comparison - Directly compare the value of any number of parameters in 2D or 3D space, pie or bar chart
Have a look to a dashboard showing some of the new chart types.
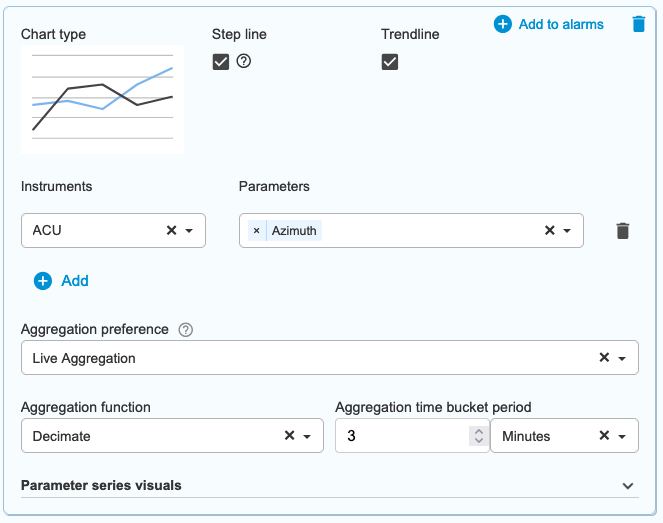
3.3 TSDB API revamp
Previously, only simple data fetching from TSDB (time-series database) was possible, without any limits. The API was rather simple and more a type of translator layer from database to REST.
After this update, the TSDB component is a lot smarter. It can limit the number of returned points, after which it uses auto-aggregation (ACG) to return up to maximum number of points. There is also an option to use live aggregation in query time.
The TSDB component has also been enriched with a lot of endpoints for reporting and analytics serving all the above chart types - and more!
4. Other changes in Monica v7.1
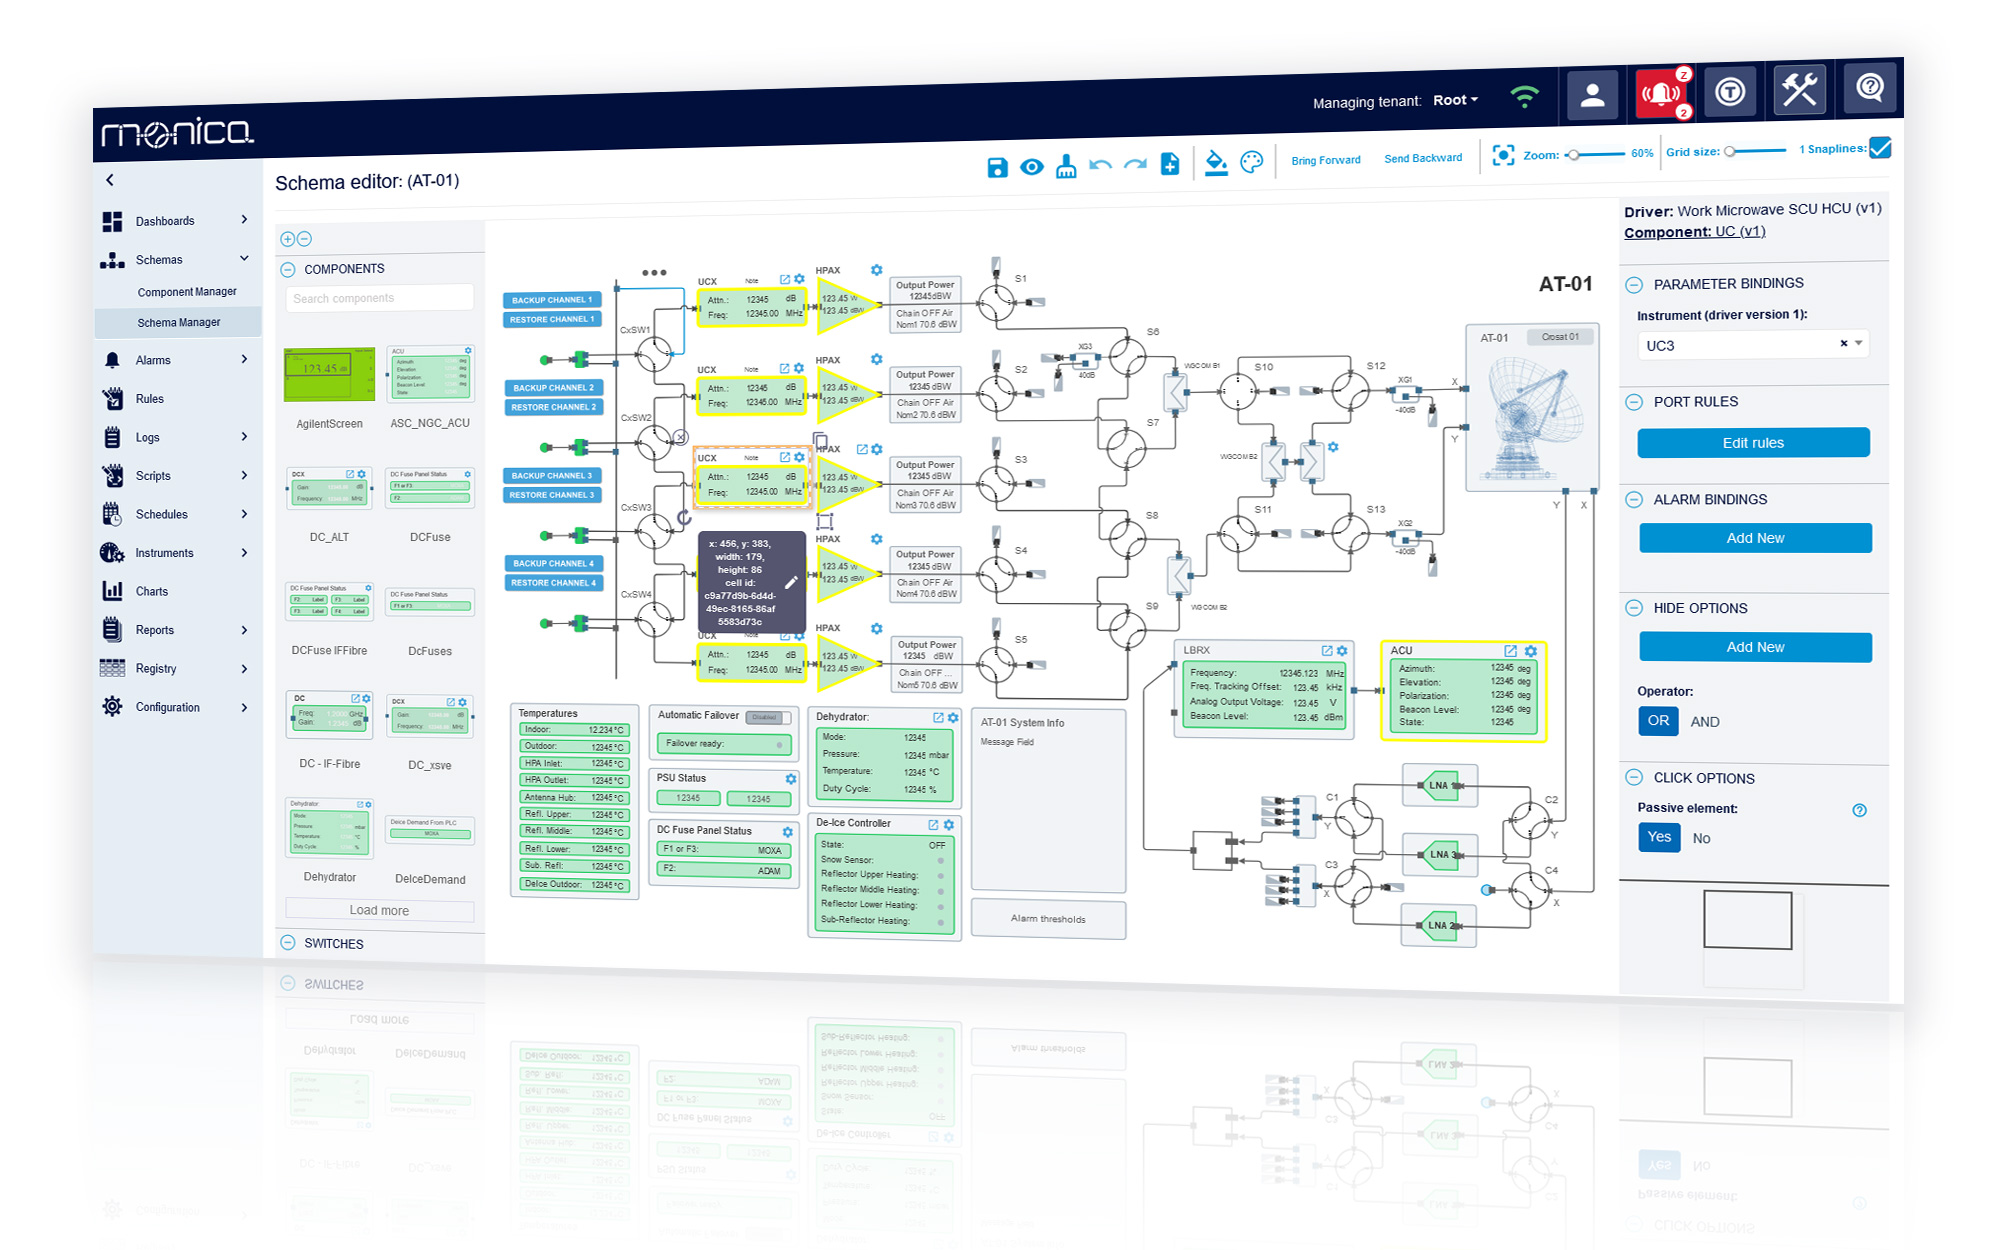
Schema - shape colouring based on parameter values
Schema - hide options → show options
Packet unpacking for Modbus drivers
Automatic execution of scripts on Monica startup
Enable Groovy language for main Scripting module
Support for virtual parameters on non-virtual instruments
Conclusion and next step
The successful deployment of Monica v7.1 marks a significant step forward in delivering enhanced scalability, increased reliability and improved overall performance for our users.
In the meantime, we've completed further development. The Monica v7.2 was released in February 2025. V7.2 includes more exciting features. Stay tuned to our Blog section and read about it in our next post.
If you wish to remind yourself about features of the previous release, find the details in the blog post about Monica v7.0.
Get in touch
Send us your feedback. We’d love to hear from you. Get in touch with us today to discuss how Monica can support your business or project.